“How to SQL
Server Profiler Trace events only a Specific database”?
In this post, I am sharing to the “SQL Server
Profiler Trace events only a specific database” step by step with YouTube
video link. It is very helpful to me and you also.
Actually, I
always forget how to configure SQL
Server Profiler to trace only a specific database.
Steps
for SQL Profiler Trace as,
1.
Open SQL Profiler.
2.
Click on the “New Trace”.
3.
Connect to your “Database Server” for Trace.
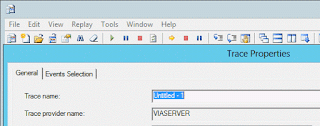
4.
The “Trace Properties” window and after click “Events Selection” tab.
5.
Click on check the checkbox “Select all columns” options.
6.
And after scroll event trace window
on right side and find the database “column
name”.
7.
And after click on “database name” check box to trace the
events like Session, Store Procedure and
T-SQL etc.
8.
And after click on “Column Filters..” button and open the “Edit Filter” popups.
9.
And after click on “database name” filter text.
10. And
after click on “like” text and add your
“database name” for tracing the
events.
11. And
click on Edit Filter “Ok” button.
12. And
click on “Run” button o “Trace Property” window.
13. Finally,
see the result on the “Untitled -1”
window.
The
Steps window for SQL Server Profiler Trace as,